Managing your analyses
Traditionally, preparing an analysis pipeline with a batch of input data files and parameter settings was a complex task. It involved installing the right tools, writing scripts, and managing output file names, which often consumed a significant amount of time and effort. However, with the advent of workflow orchestration tools like Nextflow and Snakemake, coupled with containerization technologies like Docker, the process of building and preparing analysis pipelines has become much simpler and faster. Despite these advancements, there is still a considerable amount of work involved, especially for nonprofessionals, to get an analysis pipeline ready to run.
Bioinfopipe aims to alleviate this burden by providing a platform where users, both professionals and nonprofessionals, can easily build sophisticated pipelines and submit analysis jobs without hassle. The platform offers an intuitive GUI environment that streamlines the management of analysis workflows.
The management of analyses in Bioinfopipe revolves around three levels of elements:
Project folder: This serves as a container for analysis sessions and allows you to organize your project-related data.
Analysis session: An analysis session provides a dedicated workspace for generating analysis jobs. You can create multiple analysis sessions within a project folder, each catering to a specific data set or analysis type.
Analysis job: An analysis job represents an individual analysis pipeline with input data files and specific parameter settings. Within an analysis session, you can create multiple analysis jobs. The beauty of Bioinfopipe is that all created pipelines can be easily reapplied as new jobs, allowing for pipeline reusability.
To access your recently created analysis sessions, you can navigate to the Menu bar and click on 'Analyses'. Here, you will find the five most recent analysis sessions conveniently displayed with 'cup of coffee' icons, providing quick access to your ongoing work.
1. Browsing analysis sessions
Open analysis browser page (Menu bar -> analyses -> Browse analyses), you can view all your analysis sessions in table by default. The table shows analysis session information, and by clicking 'View details' icon button you can see the full properties of the corresponding analysis session. The properties are described as follows:
ID : Analysis session ID assigned for the user.
Name : Analysis session name.
Project folder : The project folder the analysis session belongs to.
Description : A brief description about this analysis session.
Created at : The time when the analysis session created.
Created by : The username of who created this analysis session.
Updated at : The time when the analysis session last updated.
Number of jobs : The number of analysis jobs contained in the analysis session.
Owner : The owner of this analysis session.
You can edit analysis session by clicking corresponding 'Edit' icon buttons. You can delete analysis session by 'Delete' icon buttons before deleting all its analysis jobs.
In left pane, there is the tree structure of project folders with their analysis sessions, from here you can navigate to view the list of analysis session pertained to a project folder. And by clicking a analysis session, it will open a page showing its details and its analysis jobs in table. The table shows the basic information about analysis jobs and you can view more details by click 'View details' icon button. Job properties are described as follows:
ID : Analysis job ID assigned for the user.
Name : Analysis job name.
Analysis session : Analysis session the analysis job belongs to.
Description : A brief description about this analysis job.
State : Analysis job state which could be:
- Setting : Means you are setting the analysis job.
- Ready : If the job has been reviewed successfully, its state will turn to be 'Ready'.
- Queuing : As sooner as the job being submitted, its state will turn to be 'Queuing'.
- Running : When the analysis job start to run by AWS batch, its state will turn to be 'Running'.
- Timeout : If the job duration larger than job timeout limit, its state will turn to be 'Timeout'.
- Halted : If haven't received the job's updates for more than 10 min, its state will turn to be 'Halted'.
- Error : There is error when Nextflow submitting jobs to AWS batch service.
- Stopping : The job has been stopped and waiting for stopping the job.
- Stopped : If you stop the job when it is in state of 'Queuing and Running', its state will turn to be 'Stopped'.
- Completed : When the job finished, its state will turn to be 'Completed'.
Tools applied : The tools applied by this analysis job.
Created at : The time when the analysis job created.
Updated at : The time the analysis job last updated.
Owner : The owner of the analysis job.
To open a analysis session, you can click on the analysis session name in the analysis session table in a project details page, or click 'Open analysis session' button in a analysis session details page.
1.1. Creating an analysis session
To create a new analysis session, just click 'Create analysis session' button in analysis browser, it will pop up a form titled 'Create a new analysis session' with following fields:
Project : Select a project folder for this analysis session. And it will be fixed to be project folder for which you opened its project details page.
Name : Specify a name for this analysis session.
Description : Put a brief description about this analysis session.
Clicking 'Create' button, a new analysis session will be created and shown in analysis session table, you can open it to start to create analysis jobs. Also you can quickly access the analysis session in Menu bar -> Analyses.
2. Working in analysis session
Analysis session is a working console for analysis jobs where you can access any resources needed for performing analysis jobs. The layout of analysis session page have 3 main parts: the main body in the middle, the left pane and the right pane.
In the left pane, there are 3 tabs:
Session jobs : Shows list of jobs and its relevant information including job ID, job state, updated time, job name, duration. And information can be updated in real time once job submitted.
Tools : Tool list for applying to jobs. You can search and filter the tools and even set them as favourites for quick access.
Favourites : Shows your favourite jobs and favourite tools for quick access.
Guides: Shows the analysis guides with jobs/tools attached to the analysis steps, which can be directly applied.
In the right pane, there are 3 tabs for selecting data:
Your data : Where you can select the your private data files or datasets for tools' inputs.
ORG: The organizational data accessible for org users, which are managed by the PRO users in the orgnization.
Public data : Public data used to test tools, managed by Bioinfopipe.
Applied data : Shows the data files and datasets which have been selected for quick access.
Once you open a analysis session, the main body shows the analysis session details and list of analysis jobs. Clicking on a analysis job, it will open the analysis job page in the main body, showing the job settings or output page depends on job status. You can go back to the session detail page by clicking the link 'Analysis session - <session name>' in the page directory links at the top of page.
With above facilities users can set up their analysis jobs quickly, and manage jobs in a efficient way.
2.1. Creating an analysis job
To create a new job from scratch, simply click 'Create analysis job' in the analysis session, it will pop up a form titled 'Create a new analysis job', which has 3 fields to fill as follows:
Name : Specify a analysis job name under 30 characters.
Description : Put a brief description about this analysis job.
Timeout limit of job (hr) : Set the maximum execution timeout limit since the job submitted, it is 24 hours by default.
Click 'Create' button to create a new analysis job, then you can start to select tools for it. You can Edit job details by clicking the 'Edit job' button, and delete it by clicking 'Delete job' button.
Another way to create a job is to reuse existing jobs' pipelines, you can select a current job in the analysis session and clicking 'Apply as new' button to create a new job which having the same tool settings. You can also choose a job from the tab 'Favourites', then apply it as new. In the 'Apply as new' form you can change the name and put new description for the new job. Then you can just change to your input files and tweak other parameters, or add some other tools as you wish. This is particularly efficient when you need to repeat the analyses with the same or similar pipelines. Keeping limited number of jobs ( say maximum 200 jobs ) for one analysis session is good for management.
2.2. Setting up an analysis job
After creating a job in Bioinfopipe, the next step is to configure the analysis job settings. This involves selecting the appropriate tools and configuring their specific settings for the job. The job settings encompass several aspects, including:
Tool Selection: Choose the relevant tools from the available options based on your analysis requirements.
Input Specification: Define the inputs for the analysis job, which can include data files or outputs from upstream tools. Specify the necessary input files or connections to ensure the job has access to the required data.
Output Configuration: Configure the desired outputs for the analysis job. This includes specifying the file formats, naming conventions, and destinations for the output files generated by the tools.
Parameter Settings: Set the parameters for the selected tools. You can set single value or multiple values for the parameters in a batch mode. Alternatively, you can set parameters through the command-line.
Computation Capacity: Determine the computational resources required for the analysis job. This includes specifying CPU cores and memory allocation, hence to ensure efficient and optimal execution of the job.
By carefully configuring these job settings, you can tailor the analysis pipeline to your specific needs and ensure the desired outcomes.
2.2.1. Applying tools to a job
To access the list of tools in Bioinfopipe, click on the 'Tools' tab in the left pane. By default, the list will display 25 tools, showing the tool name and version. You can navigate through the pages of the tool list using the 'First,' 'Previous,' 'Next,' and 'Last' icon buttons.
By default, the tool list will show tools from the public repository maintained by us. However, you can switch to view your own tools or tools shared with you by selecting the 'Public', 'org_id', 'Owned' or 'Shared' buttons from the drop-down button. You can choose standalone tools or nf-core pipelines by clicking the switch buttons labelled 'Standalone' and 'nf-core'. You can also find tools which are grouped within collections by cliking the 'Collection' button.
To filter the tools, you can search for a specific tool name using the input box labeled 'Search...'. Additionally, you can apply filters based on public or private categories by clicking the 'Category filters' button. Once a category is selected, it will appear above the tool list table, and only tools belonging to that category or its descendant categories will be displayed. If multiple categories are selected, the tool list will show the intersection of tools between those categories. You can remove a category filter by clicking the cross icon button within the category label.
To view the documentation of a tool, click the 'View help' icon button. To select a tool, click the 'Apply' icon button, and the tool will appear in the 'Set tools' tab in the main body, displaying its parameter settings in the tool tab.
You can mark a tool as a favourite by clicking the 'Set favourite' icon button. This allows you to quickly access your favourite tools in the 'Tools' sub-tab of the 'Favourites' tab in the left pane. To remove a tool from your favourites, click the 'Remove' icon button.
Note: nf-core pipelines can only be applied independently and cannot be combined with other tools to create an instant pipeline.
2.2.2. Getting data or links for inputs
After tools being selected for the analysis job, next is to set parameters for applied tools. One of parameter types is 'InputFile' which need to get input data files from data selector or output files from other tools (denoted as pipe-in files).
To get input files from data selector, firstly select the data files from the tab 'Your data', 'Test data' or 'Applied data' in the right pane, then click the 'Get data' button at the right hand of parameter field box. The field's text will changed to be 'Datafiles: number of files'. The data files will show up in the table below the parameter filed, which has 4 columns:
ID : File ID for the user.
Filename : File name.
Label : The label of file which will be used in the output file name; it will automatically generate the label based on filename, you can edit it by clicking the 'Edit label' icon button, remember to save once finish the editing.
File type : Indicating if the file type profile of selected data files match the file type profile of the input parameter, which has 3 status:
- Matched : Means the file types of selected data files are within the scope of file type profile of the input parameter.
- PartMatched : Means only part of the file type space of selected data files are within the scope of file type profile of the input parameter.
- Unmatched : Means there is no file types of selected data files are within the scope of file type profile of the input parameter.
- Undefined: Means either the selected data file haven't assign any file types or the input parameter haven't specify any file types.
The table will show 5 files by default, you can click 'Expand/Collapse' icon button to show all files. By default all files in table will be used as batch of input files, you can further select subset of them by checking the checkboxes in table. You can clear the table by clicking the 'Clear' button at the right hand of parameter field box.
For those input parameters which allow a type of dataset as input, you can select a dataset and click 'Get data' button to get the batch of data files contained in the dataset. The field's text will changed to be 'Dataset: dataset_name, dataset_type'. If allowed dataset type is 'PairedEndSeq', then clicking 'Get data' button from one of paired input parameters, the both of parameters will get input data files from the selected dataset of 'PairedEndSeq'. If you further select or un-select a file in one file table of one of paired parameters, the corresponding paired file in the file table of the other paired parameter will also be selected or un-selected. Same for clearing action, if clicking 'Clear' button in one of paired parameters, then both of tables will be cleared.
If the target tool needs to get the upstream tool's output in a pipeline, just click 'Pipe in' button at the right hand of parameter field box, it will open a modal popup which only show up the tools which are not downstream tools to the target tool, and you can choose a upstream tool and select its output file and apply it. At the bottom right, there are radio buttons for selecting output channel modes:
Join : By the default the output channel will join with other output channels using Nextflow 'join' operation. For instance, channel A of elements (a1, a2, a3) joining channel B of elements (b1, b2) will result in channel elements ( [a1, b1], [a2, b2]).
Combine : The output channel will be combined with other output channels using Nextflow 'combine' operation. For instance, channel A of elements (a1, a2, a3) joining channel B of elements (b1) will result in channel elements ( [a1, b1], [a2, b1]).
Collect : collecting all elements as one element of a channel using Nextflow 'collect' operation. For instance, collecting channel A of elements (a1, a2, a3) will result in a channel with one elements ( [a1, a2, a3] ).
After clicking 'Apply' button, you will see the field's text changed to be 'Pipe-in: join/combine output-file-name from Tool, Matched/PartMatched/Unmatched'.
To get input directory for the parameters with type of 'InputDir' or 'InputDirIdx', you can firstly select a directory from data selector then click 'Get Dir' to get this folder into the field table showing containing 2 columns:
Directory : The full path of the folder.
Label : The label for the folder which will be used in output file names, if is 'InputDirIdx' type, you need to specify the prefix in 'Label' column by editing its value to the index prefix.
Note: making sure the input file/dir labels are unique, because they will be used in naming output files in batch job and unique labels are essential to differentiate output files.
2.2.3. Getting samplesheet file for nf-core pipelines
The main input file for an nf-core pipeline is the 'input' parameter, which accepts a sample sheet file. This file is in CSV format and consists of a table containing columns of the input file path, sample name, and related metadata; some fields are required, while others are optional.
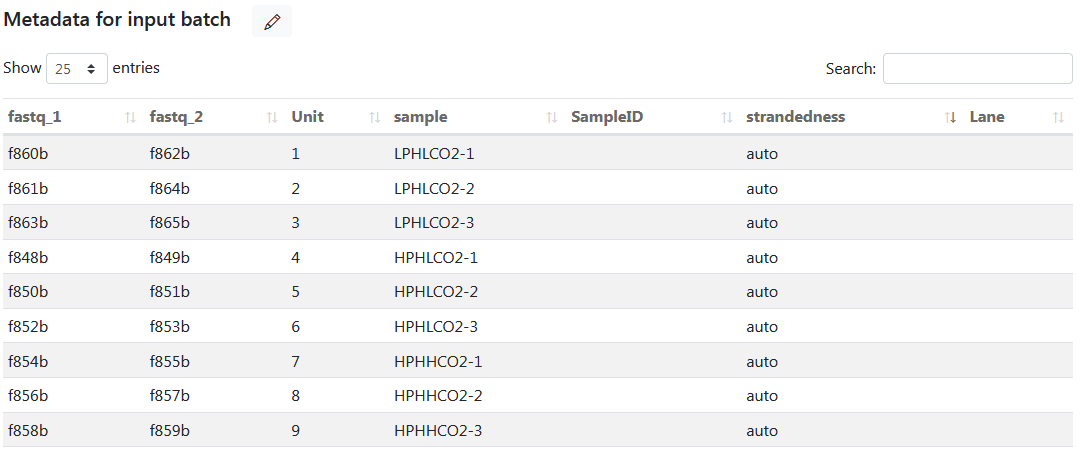
With Bioinfopipe, there is no need to create a samplesheet file separately. Instead, you only need to create a dataset with all the required columns in the metadata table of input batch, and the columns can be put in any order. For example, the following demonstrates the metadata table of the created dataset 'sample_sheet' for the 'rnaseq' pipeline.
To apply this dataset for a job, simply select the dataset and click the 'Get data' button for the 'input' parameter. Bioinfopipe will then display the samplesheet table, where you can select a subset of rows by checking or unchecking the checkboxes. Upon submitting the job, Bioinfopipe will generate a 'samplesheet.csv' file as the argument for the 'input' parameter.
2.2.4. Setting output parameters
In setting parameters for a applied tool in a analysis job, each of parameters with type 'OutputFile' or 'OutputDir' (denoted as output parameters) has a table below its field box, which shows list of output file maps pertained to the parameter. The table has 4 columns:
Save : Check it if you want save the file in output results.
Name : Name of output file map.
File type : File types assigned to the output file map.
File path : Full path to the output file(s).
The field box of a output parameter shows default output file format, e.g. 'bowtie2_$$.sam'. You can change the default name and changes will be automatically reflected in its file path. You can get the default back by clicking 'Reset' button at the right hand of field box. In the output file format, as described in the section 'Add output file' in article 'Managing your tools', $$ is a reserved place-holder which will be replaced by job-generated basename based on input file labels and the parameters set with batch arguments.
Note: It is important to keep $$ in the output file name except that the job is a single run with one output file, otherwise you will lose output files.
2.3.5. Building pipelines with flowchart
When working on an analysis job and connecting tools to build an instant pipeline, you have the option to open the flowchart view, which allows you to visualize the pipeline diagram. By clicking the 'View flowchart' icon button, a left pane titled 'Flowchart of applied tools' will open, displaying the applied tools and the links between them.
The flowchart graph consists of operators, directed links, and connectors. Each operator box represents a tool and displays the tool's name and version. Connectors correspond to input/output files and display input/output file tags. Input connectors have triangle arrows pointing inward, while output connectors have triangle arrows pointing outward. Links are drawn from output connectors to input connectors, indicating the flow of data. Links are color-coded to provide visual feedback: green for matched file types, orange for partially matched file types, and red for unmatched file types. This color coding helps identify any potential issues with the selection of input files from upstream tools, particularly the red links.
You can navigate the flowchart by dragging the diagram within the flowchart frame using the right mouse button. Zooming in and out is possible by clicking the 'Zoom in' and 'Zoom out' icon buttons located in the upper-right corner of the flowchart frame. To reset the flowchart to its original size and position, simply click the 'Reset' icon button.
The flowchart allows for quick access to specific tools within an analysis job by selecting the corresponding tool. Clicking on a target link allows you to directly access the parameter field associated with that link, which will be highlighted with a blue border. If new links are added, the flowchart will automatically adjust its layout by rearranging the positions of operators and links, following the direction of the links from top to bottom. Simultaneously, the order of the tool pills will change to match the new layout. If you clear the pipe-in of an input parameter, the corresponding link in the flowchart will also be cleared, along with the flowchart layout and tool pills' order.
Overall, working with the flowchart provides a more intuitive and efficient way to build and visualise pipelines in Bioinfopipe.
2.3.6. Setting batch arguments for parameters
The analysis job in Bioinfopipe can run in batch mode if you provide a batch of files for input parameters. Additionally, you can set a batch of arguments for other batchable parameters, indicated by parameters that support batch arguments.
To access the batch settings, you'll find a 'Batch' button on the right side of the field for every batchable parameter. Clicking the 'Batch' button will open a table of arguments below the field. This table consists of three columns:
#: The unit number, indicating the specific argument within the batch.
Argument: The value of the parameter. For number or string parameters, it can be any value. For category parameters, it represents the fixed category string. For boolean parameters, it is set as 'True' or 'False.'
Label: The label used for constructing the output file name. By default, it is the same as the corresponding argument value, but you can modify it.
For number or string parameters, the table initially displays two arguments with the values '1' and '2.' You can modify these arguments by clicking the 'Edit argument' icon button and save the changes by clicking the 'Save argument' icon button. When you modify an argument, its corresponding label will also change simultaneously if they were initially the same. You can edit the labels separately by clicking the 'Edit label' icon button. To add more arguments, click the 'New unit' icon button at the top right of the table, which adds a new row for editing. To remove an argument, simply click the corresponding 'Delete' icon button. You can select a subset of arguments by ticking the checkboxes next to the target arguments.
For category parameters, the table displays all available category arguments. You can edit labels, select a subset of arguments, but you cannot remove any of them. Similar to boolean parameters, the table will have two fixed arguments: 'True' and 'False.'
By setting batch arguments for parameters, you can test multiple arguments in batch and select the best results. If you set more than two batch parameters, the resulting number of tasks will be determined by the unique combinations between the values of these parameters and the batch inputs.
To close the batch table, click the 'Close batch' button, and the parameter field will return to single argument mode. The field will be activated, allowing you to provide a single argument. The 'Reset' button works in single argument mode and can be used to revert to the default value.
Note: The number of tasks can exponentially increase if you set many batch parameters, so it is recommended to set no more than two batch parameters if possible.
2.3.7. Setting parameters by command-line
In the job settings of Bioinfopipe, users have the option to set parameters via the command-line in the "COMMAND-LINE SETTINGS" section. Here, you can directly specify the values for parameters that are present in the sections of basic/advanced settings. The settings provided in the command-line will override the values specified in the basic/advanced settings sections.
Furthermore, you can also set parameters that are not present in the sections of basic/advanced settings. This gives you the flexibility to configure additional parameters specific to your analysis needs. By including these parameters in the command-line settings, you can ensure that they are considered during the execution of the job.
You can put command-line in one line or one parameter per line, by default all command-line settings will be put following the ones set in sections of basic/advanced settings. For example:
-p1 xx
-p2 xx
-p3 xx
-p1 xx
-p2 xx
-p3 xx
-p1 xx : 1
-p2 xx : 3
-p4 xx -p5 xx
With the command-line settings in Bioinfopipe, users have the flexibility to set any parameters that are available in the original tools. This means that professional users can directly specify repeated parameter settings in the command-line, saving time and effort. By doing so, they only need to focus on configuring the input/output parameters during the tool configuration process. This streamlined approach makes it simpler and quicker for professional users to create in-house tools tailored to their specific needs.
2.3.8. Setting computational capacity
When you submit an analysis job in Bioinfopipe, each task will be ultimately submitted to the AWS Batch service. The AWS Batch service is responsible for managing the execution of tasks within job queues. Once a task is submitted, it will be placed in a job queue until it is scheduled onto a compute environment.
The compute environment in AWS Batch is responsible for provisioning the necessary computing resources to execute the tasks. It automatically selects an appropriate EC2 instance based on the computation requirements specified by the job. The compute environment considers factors such as the type of workload, resource availability, and instance families (such as C, M, and R) to match the demand and optimize the execution of the job.
In job settings, users can set the computation capacity per tool. Go to 'COMPUTATION SETTINGS' section including following settings:
CPU size : Specify the number of (logical) CPU required by executing this tool with its data.
Memory size (GB) : Specify the memory size required by executing this tool with its data.
If the tool with its input data need more computing power then you can specify a higher number of CPU, and If the tool with its input data needs more memory to run properly then just set higher memory size. AWS batch will try to select a EC2 instance which as close both requirements as possible. For instance, if you set CPU size of 1 and Memory size of 16GB, then r5.large (2 vCPU, 16GB) instance could be chosen.
The principle here is to chosen just more than computation capacity required for the task, so that the task will get run smoothly and reduce the computational cost. You can check AWS EC2 instance types here.
2.3. Running an analysis job
After completing the job settings, it is important to review the job to ensure that there are no potential errors before submitting it. To review a job, simply click the 'Review job' button. This action triggers a validation process that checks if any settings break the validation rules.
If there are any validation errors, they will be displayed in a top error alert popup. The tools that have errors will be highlighted with a red border in their respective tool pills. Additionally, error information may be shown below the corresponding fields, providing further details about the specific errors.
Reviewing the job helps identify and address any issues or mistakes in the settings, allowing you to correct them before submitting the job for execution. This step ensures that the job is properly configured and increases the chances of successful execution without encountering unexpected errors or failures.
If everything fine in reviewing stage, then the job state will change to 'Ready', and tab 'Set tools' will be replaced with tab 'Tool settings' which contains 4 sub-sections:
Input files : The table shows list of input file objects for all applied tools; you can further check the list of input files by clicking the 'View files' icon button, where making sure labels are unique.
Output files : The table shows list of output file objects for all applied tools.
Batch parameters : The table shows all parameters which set a batch arguments for all applied tools; you can further check the list of arguments by clicking the 'View arguments' icon button.
Parameter settings of applied tools : Shows parameter settings, command-line settings and computation settings for all applied tools.
where users can review the tool settings and double checking everything is fine before submit the job.
To submit a job, just click 'Submit job' button, and job state will become 'Queuing' to wait for Nextflow to submit to the AWS batch service. And job state will turn into 'Running' when it is submitted to AWS batch to be executed.
2.3.1. Tasks of an analysis job
A task is a unit that runs within a batch job. In the context of an analysis pipeline, a task can be seen as an individual execution of the pipeline with specific input files and parameter settings. The number of tasks in a job is determined by the total unique combinations of input files from batch inputs and arguments from batch parameters.
For paired-end input parameters, the input combinations are generated using a one-to-one mapping between paired inputs. The pairs are matched in the order they appear, starting from the first pair and continuing until the last pair. If one of the pairs runs out of files, the combinations stop at that point.
Similarly, for multiple inputs from upstream tools, the combinations are created using a one-to-one mapping between the multiple inputs. Again, the combinations stop if one of the inputs runs out of files.
Let's consider an example with two paired-end inputs, each having three input files. Additionally, there is a batch parameter with two arguments and another batch parameter with three arguments. In this case, the job will generate a total of 3 * 2 * 3 = 18 tasks. Each task represents a unique combination of input files from the paired-end inputs and arguments from the batch parameters.
This approach allows for the execution of the analysis pipeline across multiple input files and various combinations of parameter settings, enabling comprehensive analysis and processing of data.
2.3.2. Viewing job dashboard
Once a analysis job is submitted, a new tab 'Dashboard' will show up. The dashboard will show the information of job tasks and time lines in real time. There are 3 sub-sections which are described as follows.
Sub-section 'Overview of job tasks' shows the completion status of the all tasks including:
Total tasks : The total number of tasks.
Completed tasks : The number of completed tasks.
% Completed tasks : The percentage of completed tasks over total tasks.
Submitted tasks : The number of tasks submitted.
Succeeded tasks : The number of tasks completed and also succeed in terms of tool exit status.
Failed tasks : The number of tasks completed but failed in terms of tool exit status.
Sub-section 'Job timelines' shows times of running job including:
Time when job started : It is the time when the job have been submmited.
Time when job finished : It is the time when the job finished.
Running time since started : It is total running time when the job turn into 'Running' state, not count time when the job stopped.
Sub-section 'Task statistics of applied tools' shows the completion status of the tasks for individual tools, so you can get task statistics for each tool applied.
For nf-core piplines, 'Total tasks' and '% Completed tasks' will not be shown because it cannot get the total number of tasks before running a pipeline.
2.3.3. Actions to change job state
After a job is submitted and in the 'Running' state, it can transition into three different states:
Completed: When the job finishes successfully, its state will change to 'Completed.' In the job list, a completed job is marked green if all tasks within the job have succeeded. However, if any tasks have failed, the job will be marked orange to indicate partial success.
Error: If there are errors generated by the Nextflow process, indicating issues with the Nextflow script or other factors causing job submission failures, the job state will be marked as 'Error.' To identify the specific error, you can check the Nextflow log file located in the job folder.
Halted: If the job doesn't receive any updates for more than 10 minutes, its state will change to 'Halted.' This state indicates a potential issue or interruption in the job execution.
Timeout: If the job's duration exceeds the job timeout limit, its state will change to 'Timeout.' This indicates that the job has taken longer than the specified timeout period.
If you need to redo a job, you should first stop the job when its state is 'Halted' or 'Timeout.' Once stopped, you can click the 'Reset job' button to delete the job's results and set its state back to 'Ready.' Then, you can click the 'Set tools' button to modify the job settings, and the job will transition to the 'Setting' state. After adjusting the settings, you can review the job and submit it again.
While a job is in the 'Running' state, you can stop it by clicking the 'Stop job' button. This will send a request to stop the job, and its state will change to 'Stopping.' If the job is successfully stopped, its state will change to 'Stopped.' However, if the job cannot be stopped immediately, it will continue running and its state will remain 'Running.' To resume a stopped job, you can click the 'Resume job' button, and the job will resume execution and transition back to the 'Running' state.
Note: It's important to note that when you request to stop a job, there is no guarantee that the underlying process will be terminated immediately. Stopping a job early in its execution is typically easier, allowing for successful termination and the ability to resume later. However, if you stop a job near its completion, it is likely that the job will complete anyway, resulting in a "Completed" state.
2.3.4. Viewing output files
When a job is completed, the results will be displayed in the 'Outputs' tab. Each section in this tab corresponds to an output file object. Within a section, the title bar provides information about the output file object, including its name, associated tool, the number of files generated, and the file types. The table within the section contains three columns:
#: The file number, indicating the order of the files.
Path to file from job output: This column displays the file path starting from the job output folder. By clicking on the link within this column, you can obtain a preview of the first 1000 lines for any text-based file.
Size: This column shows the file size of each output file.
Additionally, you can access further actions for the output files:
- To view file properties, click the 'Info' icon button associated with the file.
- To download a file, simply click the "Download file" icon button.
For image output files, you have the following options:
- To obtain an in-page preview of the image, click the 'Preview' icon button.
- To view the image in a larger size, open a new browser tab by clicking the links in the 'Path to file from job output' column. From there, you can examine an enlarged view of the image.
- To download the image, right-click on the image preview and select 'Save image as' to save it to your device.
2.3.5. Browse job folder
You can also retrieve the output files and other results in tab 'Job folder', this is where all results related to this job are stored, including 3 sub-folders:
nextflow : Contains Nextflow related files, process message file, and scripts from script tools. The files are describes as follows:
- as<2>_j<5>.nf : Nextflow script created by analysis job.
- <script_tool_name>.script : the script from script tools, loaded to the related environment to execute.
- progress.msg : The latest job states and task statistics used for updating job states and dashboard.
- job_monitor.log : The monitoring log generated from job monitor script for the job, which shows uploaded job states.
- nextflow_trace.txt : Generated by Nextflow, it is TAB table showing detailed performance per task; more details be check here.
- nextflow_timeline.html : Generated by Nextflow, to view the process execution time line across all unit run per tool; more details be check here.
- nextflow_report.html : Generated by Nextflow, to view the detailed performance of job execution including: resource usage (CPU, memory, job duration, I/O), and information about each task in the workflow; more details be check here.
- nextflow.log : Nexflow log file generated by Nextflow, you can check this file if there are unexpected errors or conditions happened.
output : Contains all output directories and files from all applied output parameters.
datasets : The output datasets created for output file objects which set a dataset type and have a batch of output files; users can directly apply the output datasets for downstream analysis.
You can download a file by clicking 'Download file' icon button, and you can delete a file by clicking 'Delete file' icon button.
To select a output files from Data selector quickly, just click 'Current session' button in the tab 'Data selector' in the right pane, it will show up all job folder in this analysis session, then you can select a job folder to open it and thus to get target output files or datasets.
2.4. Setting favourite jobs
To set a job as a favourite for quick access, you can follow these steps:
- In the analysis session page, locate the job you want to set as a favourite in the job table.
- Click the "Set favourite " icon button associated with that particular job.
- The job will now be marked as a favourite . You can find your favourite jobs in the "Favourites" tab located in the left pane.
To apply a favourite job as a new job, you can proceed as follows:
- Go to the 'Favourites' tab in the left pane.
- Locate the favourite job you want to apply and click the 'Apply' icon button.
- A modal popup titled 'Apply this job as a new job' will appear, containing the following fields:
Name: Enter a name for the new job.
Description: Provide a description for the new job.
4. Fill in the required information and click the 'Apply' button.
A new job will be created with the same tool settings as the favourite job. You can modify the input/output settings to run the analysis on your specific data.
This feature is particularly useful when you need to run a pipeline frequently on different datasets. By setting a job as a favourite, you can quickly access and apply it as a new job, saving time and effort in configuring the tool settings each time.